 In a press release dated February 27th Beyond Meat Inc. (BYND) announced results for the 4th Quarter ending December 31st 2023.
The following table summarizes the results for the period compared with the values for the corresponding quarter of the previous fiscal year (Values expressed as US$ x 1,000 except EPS)
|
4th Quarter Ending December 31st
|
2023
|
2022
|
Difference (%)
|
|
Sales:
|
$75,679
|
$79,938
|
-5.3
|
|
Gross profit /(loss):
|
$(83,859)
|
$(2,931)
|
-2,761
|
|
Operating income/ (loss):
|
$(160,803)
|
$(65,721)
|
-144.7
|
|
Pre-tax Income/ (loss)
Net Income/ (loss)
|
$(155,072)
$(155,110)
|
$(58,757)
$(66,867)
|
-163.9
-132.0
|
|
Diluted earnings per share:
|
$(2.40)
|
$(1.05)
|
-128.6
|
|
Gross Margin (%)
|
-110.8
|
-3.7
|
-2,895
|
|
Operating Margin (%)
|
-212.5
|
-82.2
|
-159.5
|
|
Profit Margin (%)
|
-205.0
|
-83.6
|
-145.2
|
|
Long-term Debt: Dec. 31st
|
$1,213,464
|
$1,189,931
|
+2.0
|
|
12 Months Trailing:
|
|
|
|
|
Return on Assets (%)
|
-17.3
|
|
|
|
Return on Equity (%)
|
N/A
|
|
|
|
Operating Margin (%)
|
-97.6
|
|
|
|
Profit Margin (%)
|
-98.5
|
|
|
|
Total Assets: Dec. 31st
|
$774,450
|
$1,062,224
|
-27.2
|
|
Market Capitalization March 12th.
|
$574,410
|
$784,670
|
-26.8
|
NOTES:
R&D expenditure declined 29.0 percent from Q4 2022 to $9.2 million or 12.5 percent of revenue
S&G expenditure increased 44.5 percent from Q4 2022 to $67.7 million or 91.7 percent of revenue
For FY 2023 net loss was $(338.14) million on sales of $334.38 million with a diluted EPS of $(5.26). Comparative values for FY 2022 were a net loss of $(342.77) million on sales of $418.93 million with a diluted EPS of $(5.75).
For FY 2023:-
52-Week Range in Share Price: $16.13 to $8.31 50-day Moving average $7.59
Forward P/E: Neg. Beta 2.5
Insiders hold 8.7 percent of equity, Institutions 38.7 percent.
Comments:-
For the 4th Quarter of 2023:
U.S. sales represented 58.0 percent and International 42.8 percent
Of U.S sales 75.0 percent were through retail channels, up from 70.8 percent in
Q4 2022. The remainder of sales was to the food service sector.
Of International sales 42.9 percent were through retail channels, down from
45.1 percent in Q4 2022. The remainder of sales was to the food service sector
Average unit revenue in Q4 2023 for all sales attained $4.23/lb. compared to $4.96/lb.
during the corresponding quarter of 2022.
Guidance for FY 2023 included:
Net revenue of between $315 and $345 million, approximately 2.5 percent below
FY2022
Gross margin mid to high teens
Operating expenses $180 million
Capital expenditure $20 million
Continued negative cash flow
In commenting on results Ethan Brown president and CEO stated:- “Though we are encouraged by pockets of growth, particularly in the EU where we saw double digit gains in net revenues on a year-over-year basis, we are disappointed by our overall results as we continue to experience worsening sector-specific and broader consumer headwinds. As we shared last week, we are conducting a review of our global operations for purposes of further and significantly reducing our operating expense base as we seek to accelerate our transition to a sustainable and, ultimately, profitable business. And while we expect current headwinds to persist in the coming quarters, we have confidence in the long-term trajectory of our business, its central relevance to the intensifying health, climate and natural resource challenges facing our global community, and our ability to emerge as a stronger, leaner organization as a result of the decisive measures we are undertaking to fit the current macroeconomic reality and business environment.”
Despite this optimistic commentary the reality includes:-
- An accumulated deficit of $1,081 million.
- Trailing 12-month negative operating cash flow of $108 million
- Inventory valued at $130,336 representing 1.8 times Q4 sales
- Effective February 29th 38.1 percent of float was short
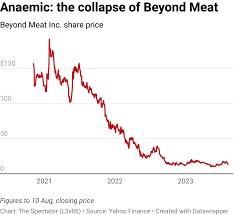
- Share price off 47.9 percent over past 12 months
- Institutional holdings declined from 63 percent to 39 percent over past year.